Cloud computing has taken over the IT world by storm. We have moved from the traditional system of in-house servers to virtual infrastructure in our cloud platforms. We use our cloud providers for all kinds of applications, and there are hardly any problem statements that we cannot solve on the cloud. The scalability, ease of use, and high availability make the cloud an obvious and an important choice for most modern applications. AWS is the leading cloud provider in the world. It has over 200 services and controls a massive chunk of the cloud market share. Thousands of startups and MNCs trust AWS as their cloud provider. With such a high demand for the AWS Cloud platform arises a need for the monitoring of our services in our account. AWS has a shared responsibility model. Some services in AWS are automatically managed, while others have to be managed by the user. Even if AWS was to do its part to the fullest, there could be scenarios where the hardware of your service malfunctions or your application crashes. All these scenarios and possible crashes should have a monitoring system. Monitoring your AWS resources is one of the best ways to ensure that your resource (or your application) is efficiently performing to its capacity. Monitoring is a major topic in most of the AWS certification exams. AWS understands the importance of monitoring and why it can be critical for applications to have an efficient monitoring system. It is not only meant for application or system failures. It can also help you make important changes to your application architecture based on your monitoring insights.
First-Party AWS Monitoring Tools
AWS offers some native monitoring tools. Let’s have a look.
AWS CloudWatch
AWS CloudWatch is the basic and important service from AWS. For the most part, CloudWatch is free to use, but it has some detailed monitoring features for which you might have to pay some money. It is a native tool to AWS, and it provides you with actionable insights for your AWS account services. One of the most important features of your AWS ClooudWatch is the CloudWatch Alarms. CloudWatch allows us to set alarms for its metrics. For example, you can set an alarm for the CPU Utilization of an EC2 instance. So now, whenever the CPU Utilization of your instance crosses a certain limit, the alarm goes off. This alarm can further integrate with several other services to notify the account user or automatically heal the application environment. CloudWatch also has a dashboard called the CloudWatch Logs. This is the log archive for your AWS services. Most AWS Services are either automatically integrated with AWS CloudWatch or can be easily configured to send logs to the CloudWatch Logs. We can also configure CloudWatch to work with our on-premise servers by simply installing and configuring the CloudWatch agent.
CAST AI
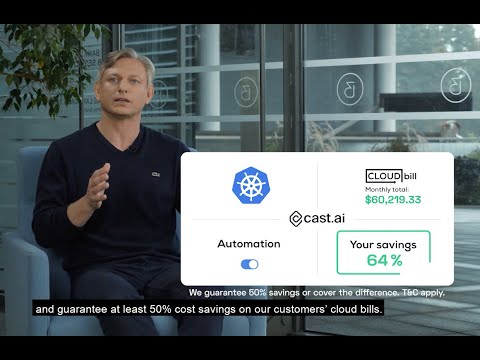
CAST AI helps engineers to fully automate Kubernetes and reduce their cloud costs by 65% on average for cloud-native companies. The platform was created for DevOps teams to save time, eliminate manual tasks, and gain full visibility into their Kubernetes costs and security. The platform comes with full automation features, including autoscaling, spot instance automation, bin packing, and free cost monitoring and security insights. Features:
Instant Rebalancing – automatically optimize your cluster for cost and performance in a few minutes. Real-time autoscaling – seamlessly autoscale instances in real-time, based on actual workload requirements Spot instance automation with Fallback – Increases your cost savings with spot instances and keeps your workloads running no matter what happens. Cost monitoring and reporting – monitor and report on the exact costs of your clusters, namespaces, and workloads in real time. Security Insights – get all the key security insights in one place, prioritize configuration issues and vulnerabilities, and share your findings easily.
Connect your cluster to CAST AI and see how much you can save. After exploring the available savings and cost reports, onboard the cluster and set the Autoscaler policies to manage the cluster for you. It takes just a few minutes to optimize your cluster for both cost and performance. CAST AI abstracts layers of technical complexity from the user, so there is little knowledge required to use the product.
AWS CloudTrail
CloudTrail is a unique service from AWS. It monitors and records all the activity in your AWS account. It records every change you make to your infrastructure or your AWS account. For example, let’s say you found out that certain IAM roles are deleted from your account. You can search for the DeleteRole action in the CloudTrail and filter the results to get all the information about the delete operation on these roles. CloudTrail keeps track of the entire API call that can help you know who or what service deleted these roles, when these roles were deleted, and so on.
AWS Config
AWS Config is another monitoring tool. It allows us to create rules to assess, audit, and evaluate the configurations of our AWS resources. This means that we do not see metrics or logs in the AWS Config dashboard. Instead, we can set up some rules that, when breached, will be highlighted in the Config console. A common example for AWS Config can be that you can set a rule that triggers if the SSH port (the port 22) is open to the internet (0.0.0.0/0). It is not a best practice to have an SSH port open to the internet, so this rule allows you to enforce your control over security groups.
Third-Party AWS Monitoring Tools
As your application grows, your AWS services can increase manifold in number. This further means that AWS CloudWatch Metrics and Logs are going to increase. Finding the correct information in these raw metrics and data can be extremely overwhelming and probably impossible in some cases. This is where we need third-party applications that are able to provide actionable insights by analyzing our cloud resources, logs, and metrics.
Datadog
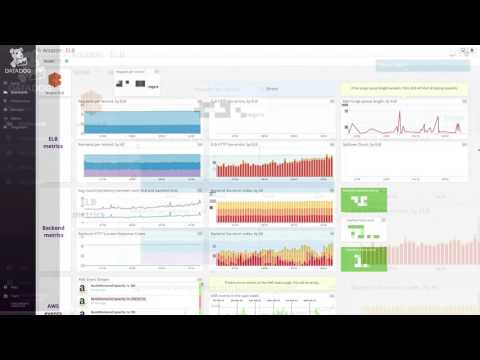
Datadog is hands-down one of the most powerful and comprehensive tools for monitoring on AWS. It is a SaaS platform for monitoring and analytics of AWS resources to help you quickly filter and analyze logs and metrics for troubleshooting or simply gather data about your application. Datadog is officially an AWS Advanced Technology Partner. It is a subscription-based platform and has a 14-day free trial period. Features
Flexible pricing options and plans. Cloud-based platform. Color-coded, easy to use, and customizable dashboards. Real-time insights on application and infrastructure metrics.
Datadog gives you a single, customizable and diverse dashboard for all your AWS monitoring needs. With over 350 vendor-supported integrations, Datadog can seamlessly collect metrics across the entire service stack of your AWS account, thus providing you with a live statistic of this data. Additionally, you can also use Datadog for a hybrid cloud environment by configuring your on-premise servers and applications for Datadog monitoring.
Paessler PRTG
Paessler PRTG is a popular AWS monitoring tool. It uses AWS service sensors to gather AWS CloudWatch metrics from AWS and provide you with performance insights. PRTG aims to reduce the troubleshooting time of your AWS applications by helping you bypass many problems entirely. PRTG has pre-configured sensors that allow you to gather AWS CloudWatch data for several AWS Services. Further, these sensors are highly customizable and can be configured as needed. Features
Customizable Dashboard. Pre-configured AWS Sensors. Free up to 100 sensors.
PRTG has one month free trial period, after which we can use PRTG for free if we need less than 100 sensors.
New Relic
New Relic is an AWS Advanced Technology Partner monitoring service. We can use New Relic to see everything that happens in our AWS Account in real-time. Pixie helps understand the intra-cluster communications to pinpoint the bottleneck performance issues and reduce vulnerabilities. New Relic integrates with several AWS Services providing you with a real-time view of the metrics and performance issues. It allows you to build custom dashboards and perform the “slice and dice” operations on the AWS data. Features
Cloud-Based platform. No setup and maintenance are required. Scales with your infrastructure. Allows us to build custom dashboards and alerts. Instantly tracks costs of the AWS account and forecasts costs for future growth.
New Relic can be utilized by startups participating in the AWS Activate program.
LogicMonitor
LogicMonitor is a cloud-based platform that provides us with a unified platform for all our AWS Metrics. It requires a simple three-step set up to monitor your AWS account and applications. It uses enhanced visualizations and provides instant visibility to metrics, logs, and resources for quick troubleshooting. Features
Built-in alerts for best practices. Unified dashboard for multi-cloud applications. Quick and easy integration. Patented algorithms to detect log anomalies. Performs an ROI analysis to observe AWS costs and inform about potential cost savings. Forecasts future expenditure based on historical data.
LogicMonitor can seamlessly integrate with several cloud platforms like GCP, Azure, and AWS for our multi-cloud applications. The tool can also be used for monitoring our on-prem servers.
ManageEngine: Applications Manager
The application manager is the cloud monitoring tool made by ManageEngine. It aims at providing actionable information from raw Cloudwatch data and logs. Applications Manager can integrate with on-prem (hybrid cloud) and multi-cloud environments for comprehensive monitoring of your application. The tool provides a consolidated view of the entire infrastructure and identifies the critical issues in AWS resources. Features
Provides actionable insights from raw AWS metrics and data. Identifies inconsistent resources. Customizable dashboards. Allows us to create alarms and anomaly profiles and associate corrective actions with them. Simple to use, even for non-tech people. Automatically detects databases, servers, and other devices in real-time.
ManageEngine: Applications Manager supports multiple services like EC2, Lambda, AWS billing, RDS databases, and much more. It collects all the performance data in the form of metrics and events and provides a unified view of the AWS infrastructure and applications.
Nagios
Nagios XI is an open-source monitoring tool for AWS and on-prem servers. The tools generate notifications for any unusual behavior in your account, and the dashboard gives detailed updates on the server statistics, which help reduce the overall troubleshooting time. Features
Quick insights and alarms. Simple configuration wizard. Easy to use. Lots of free plugins that can be used for advanced features. Allows users to create alerts for system failure and threshold breaches.
Nagios is one of the low-cost AWS monitoring options, but most of the features of this product are very advanced and very easy to use.
SolarWinds
Solarwinds Server and Application Monitor is an application designed for monitoring servers. It has several features dedicated to the AWS Cloud. The tool automatically detects changes (for example, a new EC2 instance) in your AWS account and starts monitoring its metrics. It can also be used with on-premise servers. Features
Supports auto-discovery of new servers. Customizable dashboard. Allows for monitoring hybrid applications.
Solarwinds is a fairly technical platform, and it can be slightly difficult to understand for non-tech users.
Splunk
Splunk is a widely used software and a respected brand for application monitoring. It allows us to view AWS changes and prevent any unauthorized and abnormal activity. All of this information is available on a clear, unified dashboard. Splunk can also ingest your CloudWatch logs for archiving purposes. All in all, Splunk is a great tool for AWS monitoring, but it is more suited for large enterprises.
Conclusion
When choosing a 3rd party monitoring tool, choosing a comprehensive, efficient, and cost-effective tool is very important. I recommend starting with using tools that have a decent trial period or a money-back guarantee. It is also very important to note that the tool you choose should cover most AWS services, not just the common ones like S3 and EC2. You might also want to consider features like live monitoring and SMS or Email alerts based on your requirement. I hope the above list helps you make an informed decision about choosing the right AWS monitoring tool.
![]()


![]()
![]()
![]()
![]()

![]()


![]()
![]()
![]()

